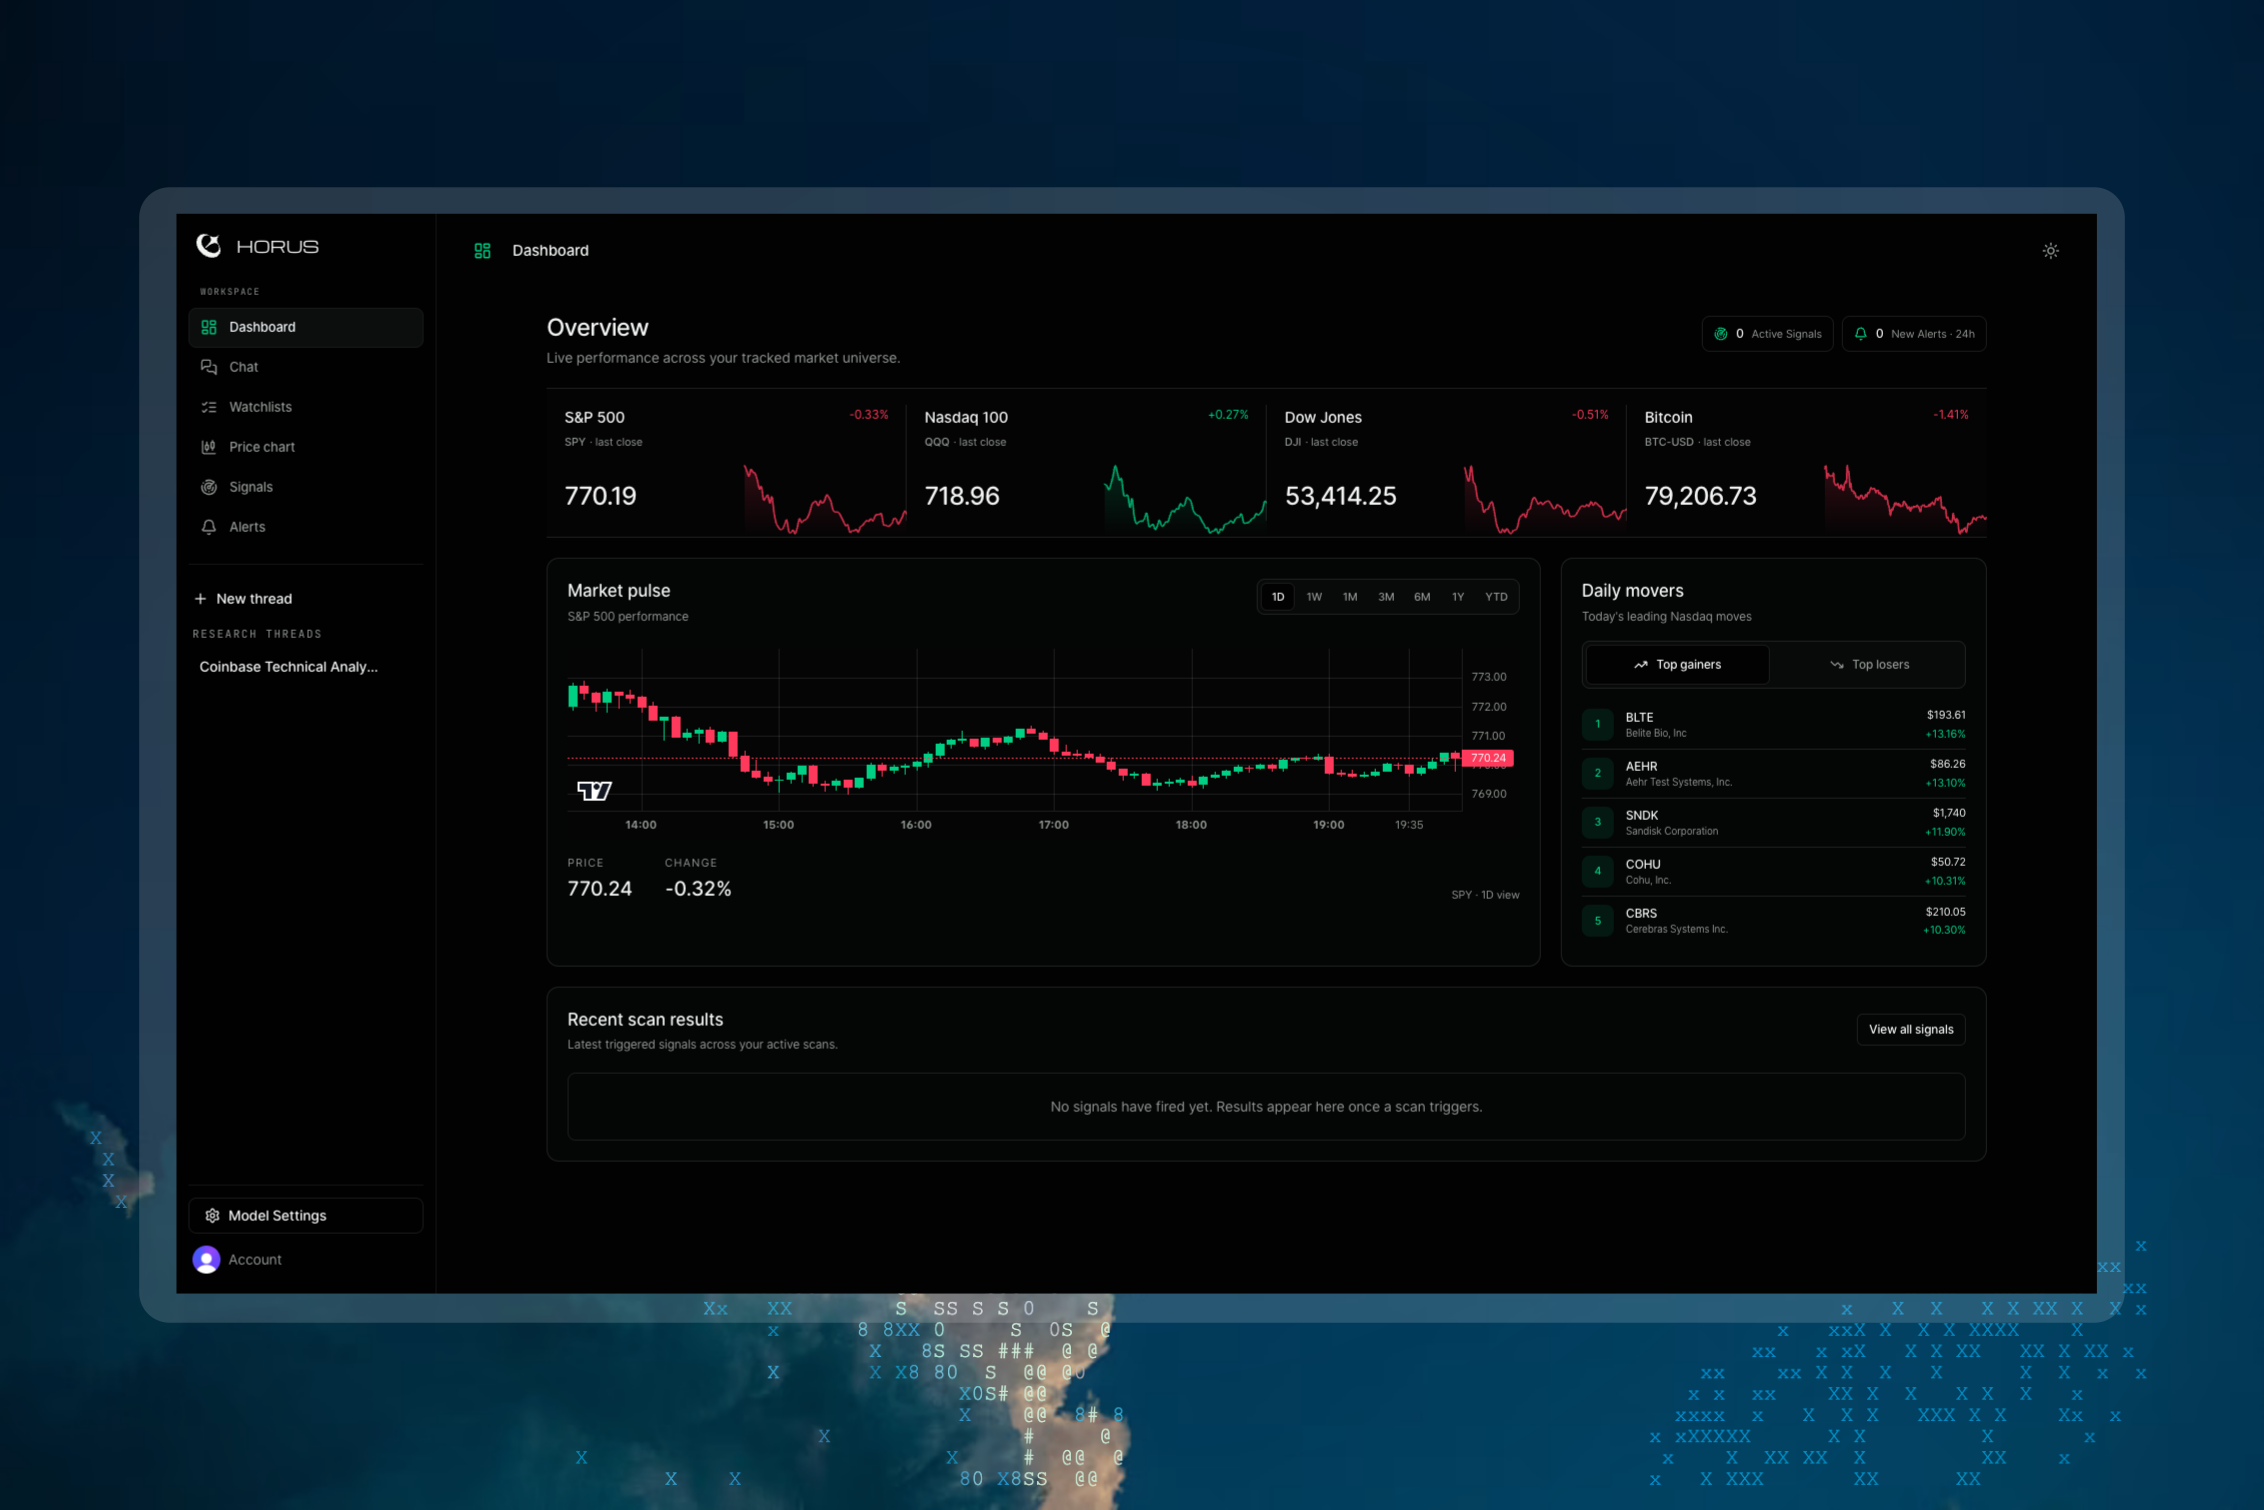
Horus Scanner
Overview
Horus Scanner is a free-to-use platform for stock market research and signal scanning. It’s an agent harness with live market data. Some features:
- Screen stocks in a given market on a schedule, build custom signals
- Generate 10+ different chart types (e.g. Forward Returns, Price Overlay, Fundamentals, Sector Rotation)
- Pull sentiment from X/Reddit, gather news, and search the web
- Interactive price charts with indicators
- Agent mode: Do all of the above, using your favourite LLM with BYOK
The core of the platform is the Horus MCP server. It exists as a standalone open-source project (see GitHub link) and enables agents to gather live market data, scan for signals programatically, and generate charts. It’s local-first, with your data stored in SQLite on disk for privacy. You can connect it to any local agent like Claude, Codex, OpenClaw, Hermes Agent etc.
Scanning
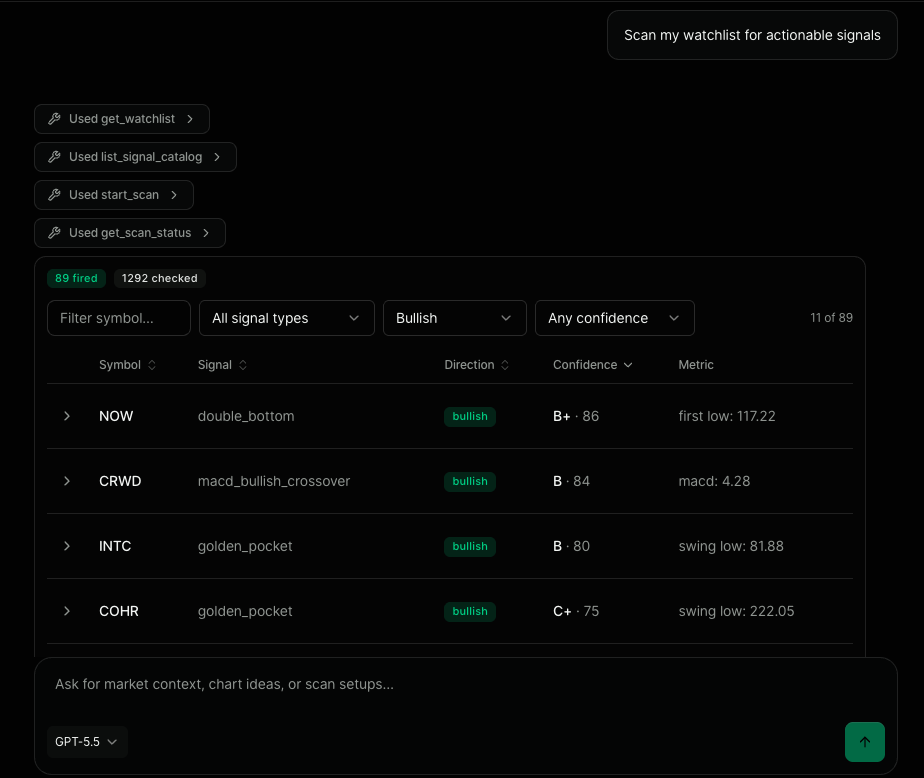
The MCP server offers a range of pre-configured signal types. Each signal comes with a set of modifiable parameters such as lookback length, thresholds, and moving average types. A signal can also be configured to a set of stocks, a watchlist, or an entire market universe.
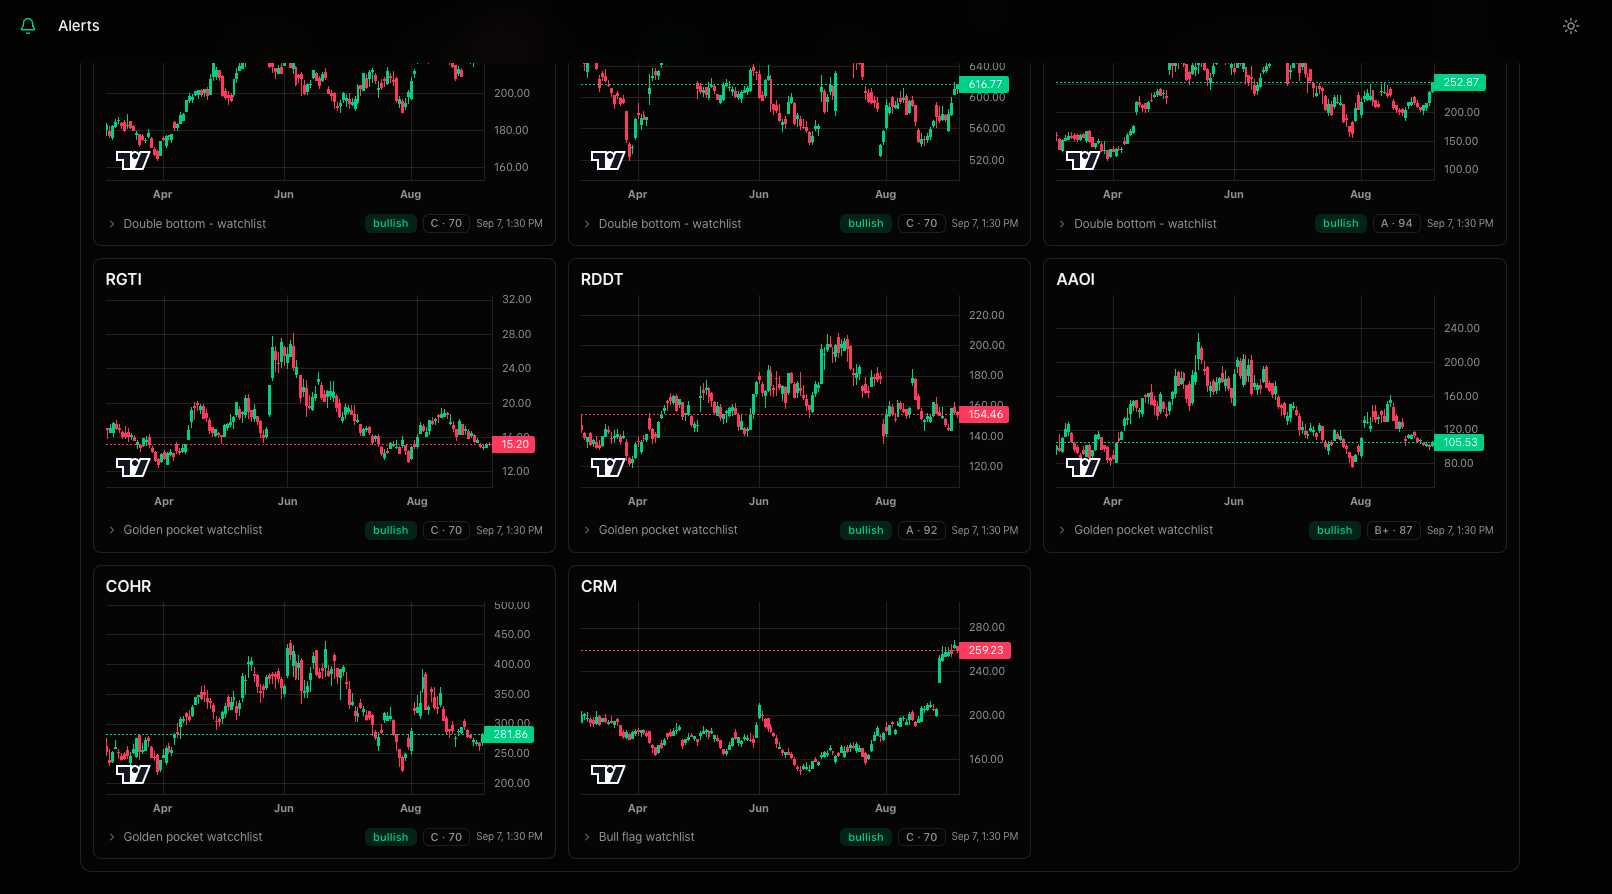
Once a signal is scheduled, it runs daily at that time. Scan results are stored and visible on the dashboard, or by querying the AI agent. Results are given a confidence score ranging from D to A+ indicating how well the signal type was fitted to.
Charting
A common issue with most stock screeners is that they lack the visual verification needed for some less strict signal types such as head and shoulders or double bottoms. Charting solves this by giving agents and humans the ability to verify these signals on a chart.
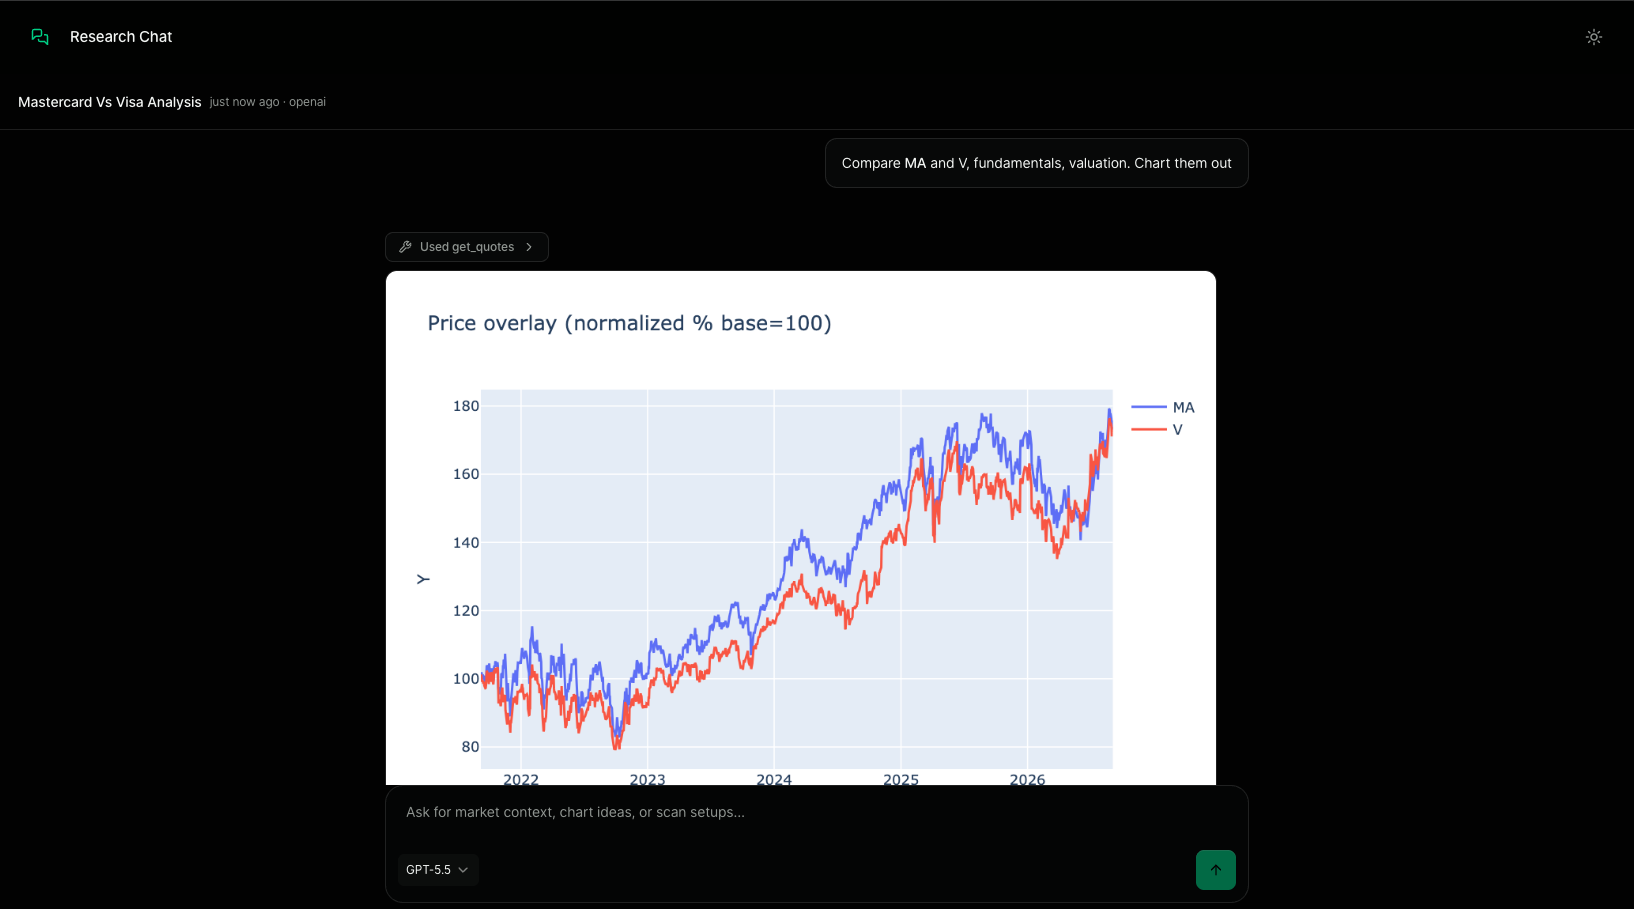
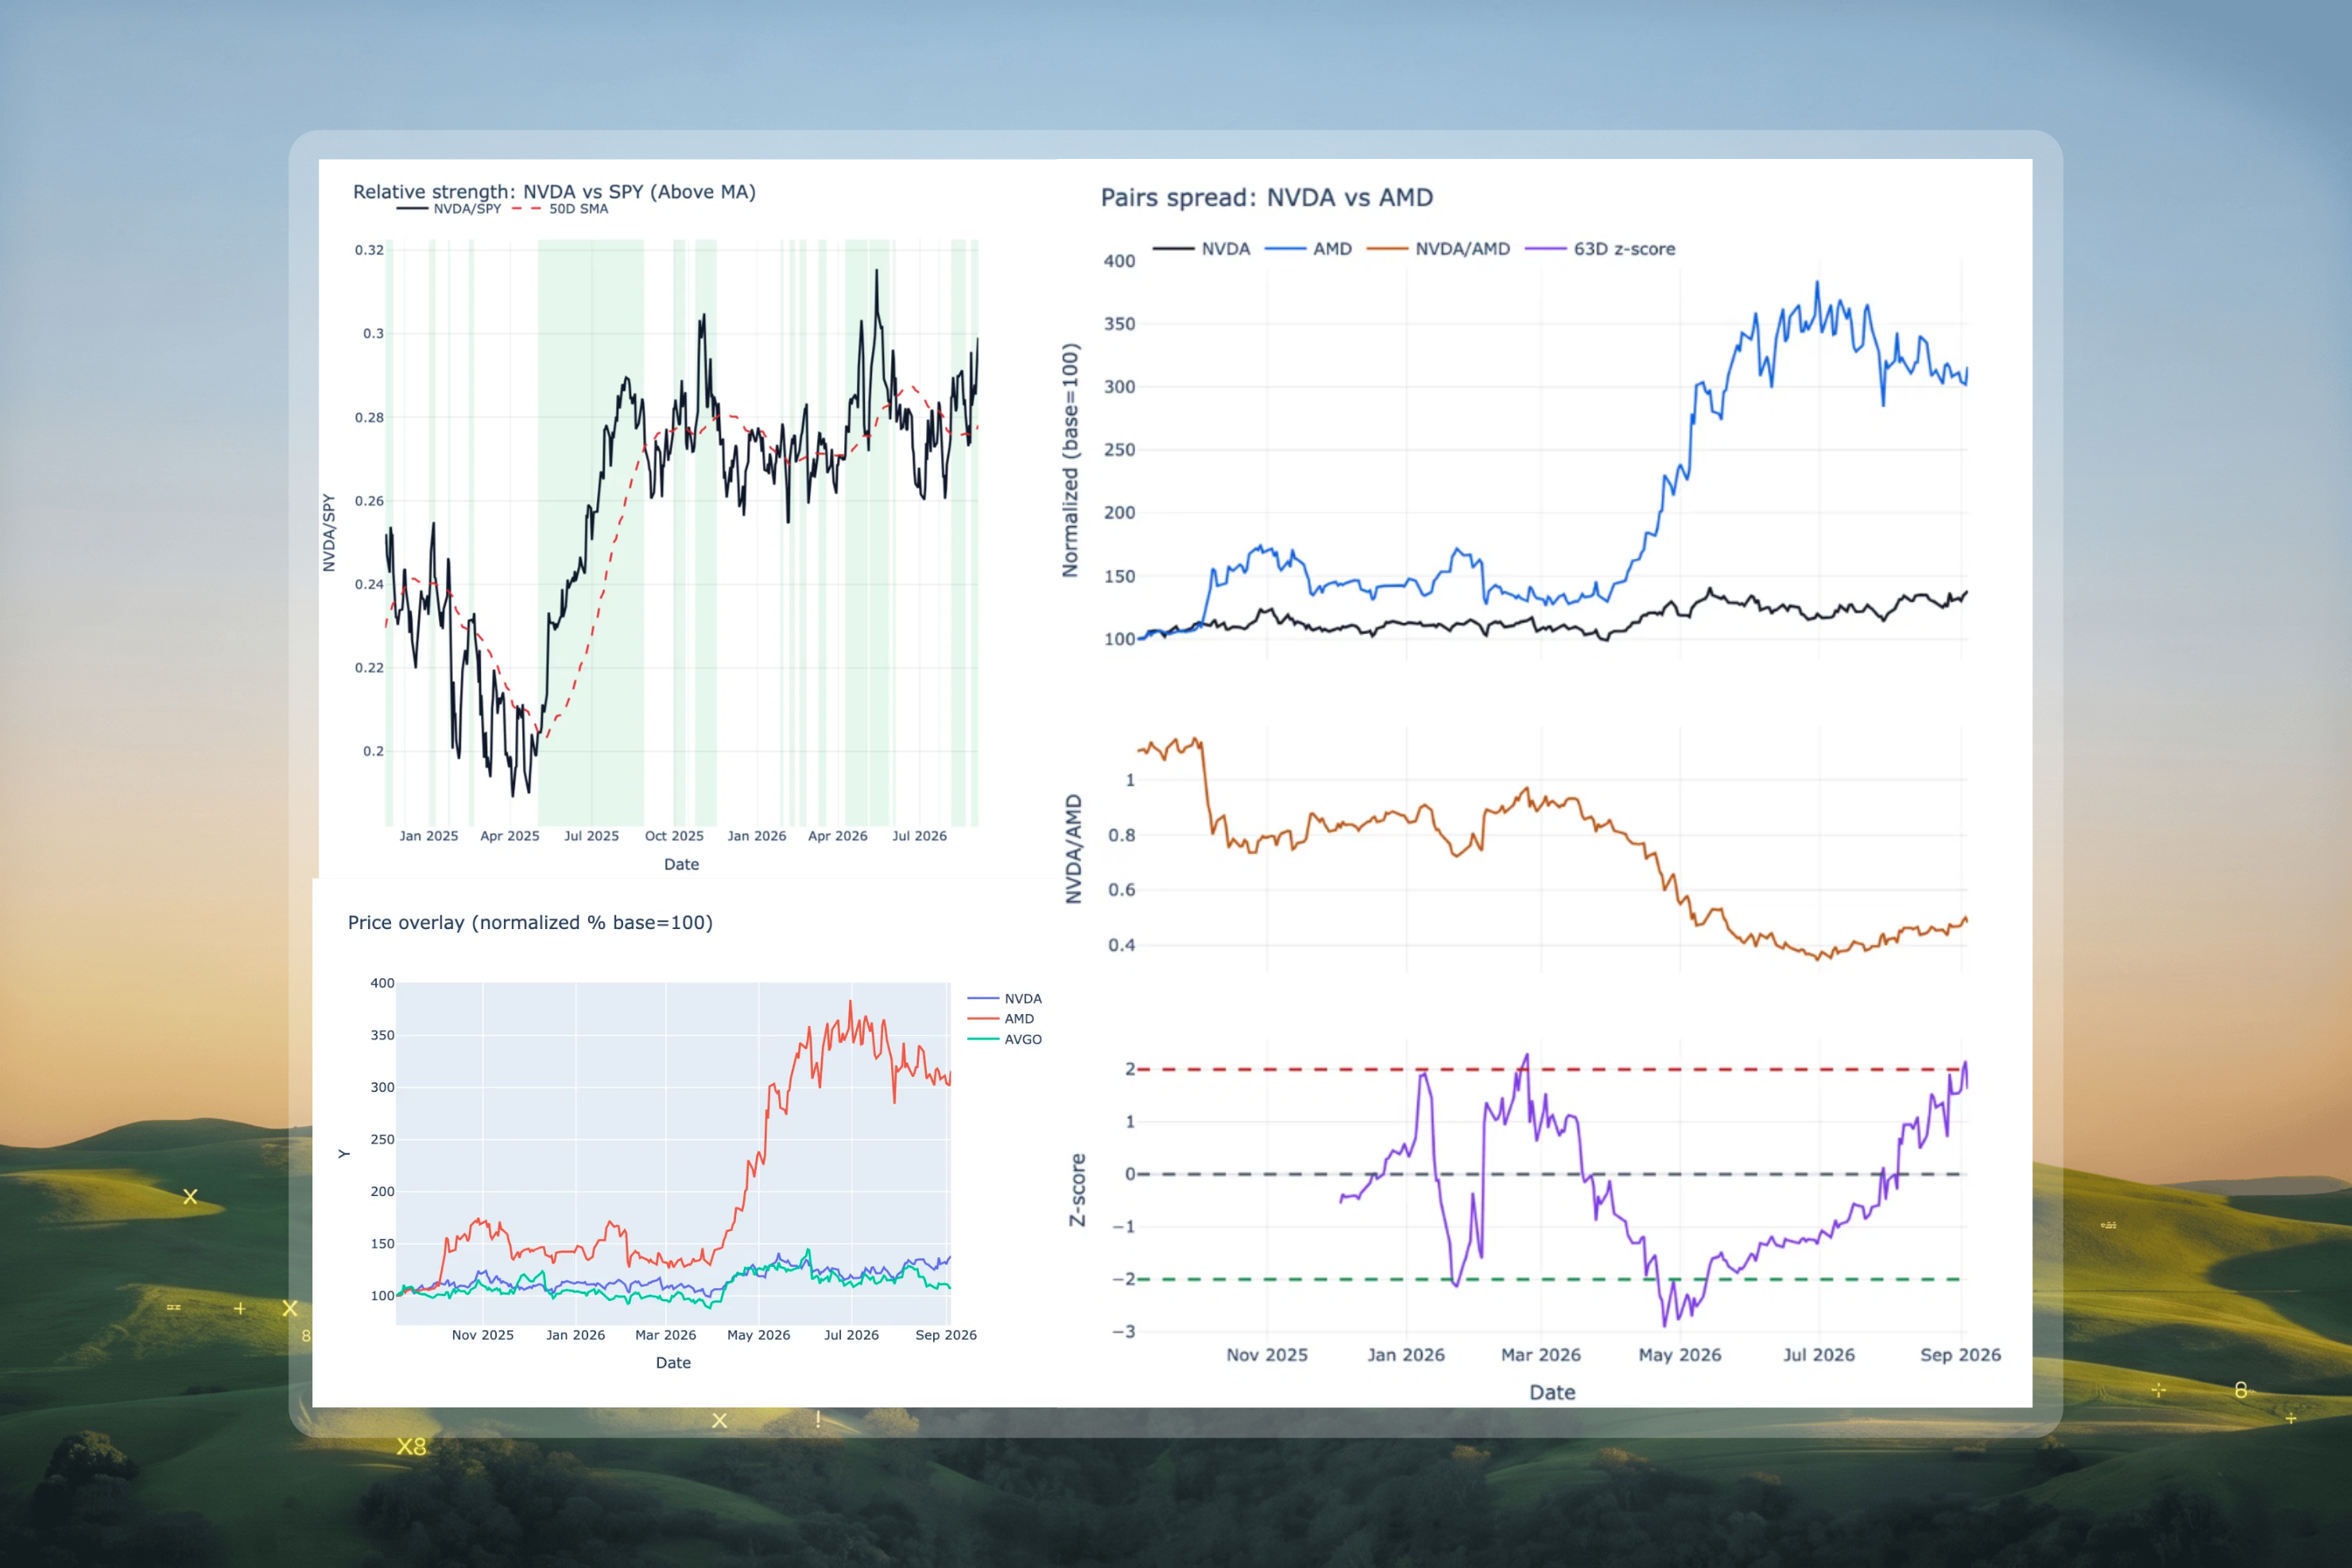
Charting doesn’t just stop at price charts. I built in over 10 chart types enabling users to perform in depth market research. Relative strength charts help compare different securities, sector rotation charts help visualize broader market trends, and fundamental charts are useful for visualizing revenue or earnings growth in relation to the actual stock price.
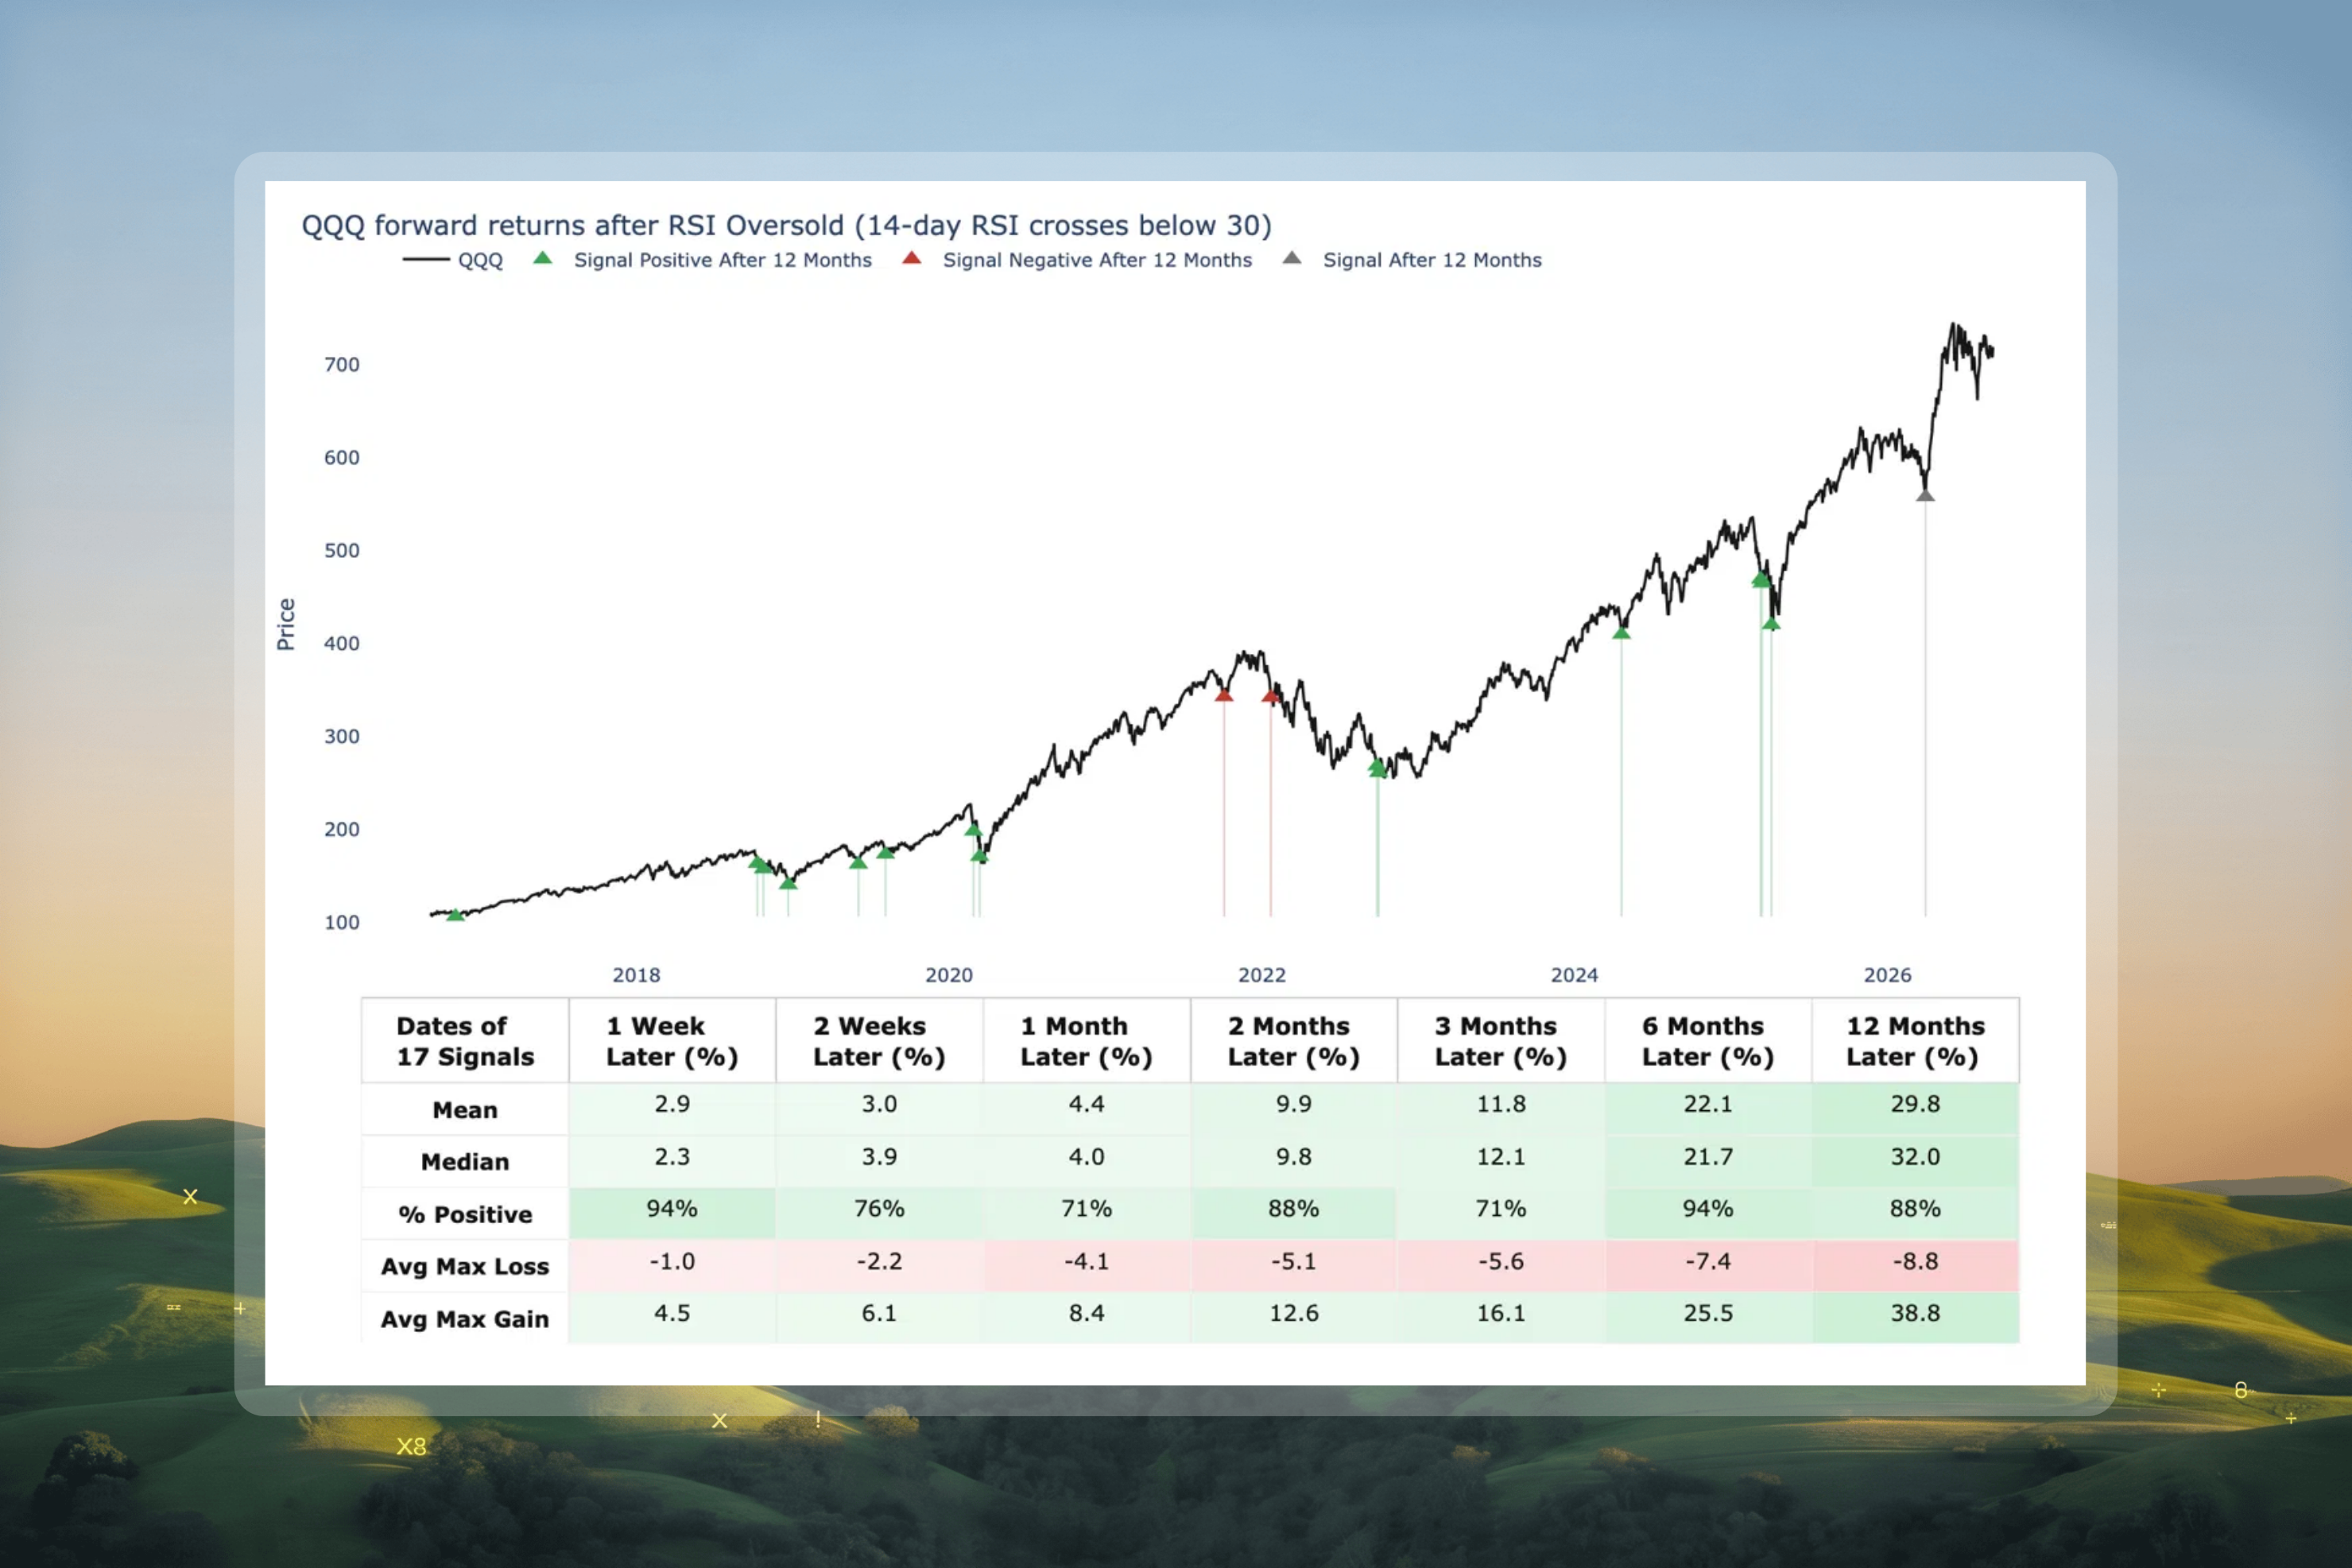
My favourite chart, and the most useful in my opinion, is the forward returns chart. It looks back in history and calculates average forward returns after a specific signal or event type. Custom events can be passed in via an array in the chart_forward_returns tool, which when paired with agent web search, is useful in identifying custom events such as major IPOs in the market and charting the forward returns after such IPOs.
Web App
To bring this product to less technical users, I decided to wrap the MCP in a web app. It includes some nice additional features like the price chart, courtesy of TradingView’s lightweight-charts library.
The app is deployed in a Google Cloud Run instance, with a Bun API server and FastMCP sidecar. Scheduled runs tick every minute via Cloud Scheduler and run any scans due at that time.
Try Horus at https://www.horusapp.site/